“ Debugging is twice as hard as writing the code in the first place. Therefore, if you write the code as cleverly as possible, you are, by definition, not smart enough to debug it. ” — Brian Kernighan
I debug a lot. You probably debug a lot as well. All developers when start working on an existing project debug a lot. So it’s important to know how to leverage all the available tools. Unfortunately, at the moment the official documentation on debugging tools and practices in Angular is lacking so this article is aimed to provide you with the knowledge to become Angular debugging ninja 😊.
The first part of the article shows the approach I use when debugging source code. The second part of the article explores debugging API provided by the framework that you can access in a browser console — mostly
ng.probefunctionality.
Before we begin, please note that all current debugging API is marked as experimental and may change in the future versions of Angular. The content described in the article is based on the current major version 4.x.x.
Debugging source code
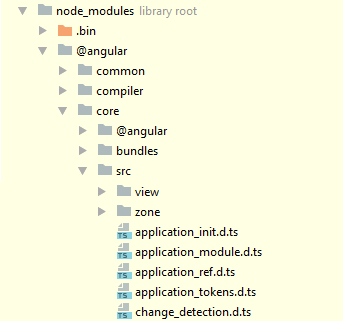
Angular sources come from two locations — npm modules and github repository. Unfortunately, Angular npm package doesn’t contain easily accessible TypeScript (TS) sources. Only the type declarations files are provided:
TS sources are still included into the bundled JavaScript mapping files in the sourcesContent field. But they are concatenated and hence not readable.
If you want to explore TS sources comfortably with the IDE help, you will have to clone github repository to your machine and check out the required version using corresponding tag. For example, the following code clones sources into
ng folder and checks out version 4.0.1:$ mkdir ng && cd $_ $ git clone https://github.com/angular/angular.git .$ git checkout tags/4.0.1
Angular’s build process packages sources in UMD modules located at
node_modules/[module-name]/bundles/[module-name].umd.js. For example, core module is located at node_modules/core/bundles/core.umd.js. Angular provides minified files and map files as well. The files placed at this location will be loaded into a browser either through module loader like SystemJS or as part of a bundler like Webpack. If you are not familiar with SystemJS, you can read here to understand why it’s used.
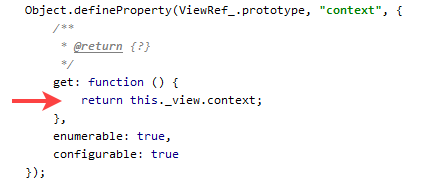
I explore the sources in IDE and use debugger in a browser to reconstruct program execution flow with the help of call stack. When setting breakpoints in a browser and following call stack I use JavaScript files, not TypeScript. The main reason is that debugging TS in a browser is far from optimal experience. Here is just one example.
I don’t find reading compiled JS sources hard, but you have to make sure that you’re loading non-minified version into the browser. At the moment, both
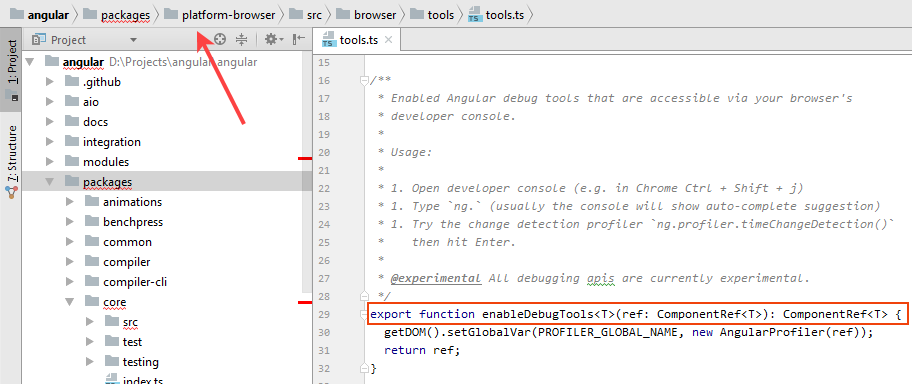
SystemJS and Angular-cli is configured to load non-minified files. Whenever I see something unclear in JS files I use TS sources in the source repository. If I need to debug some functionality in JS, I note what module this functionality is located in, open this module in a browser, find the piece of code and put a breakpoint there. For example, I’m looking at the enableDebugTools function:
I can see that it’s in the
platform-browser module. So I go to a browser and look for platform-browser.umd.js file:
and then find the function
This approach works if you’re not using
Angular-CLI, since it uses Webpack to bundle everything into one big file. You can also find the function in this file, but I recommend debugging with a simple setup without any bundlers.
Sometimes you may need to put a breakpoint inside one line function expression:
It’s easy with the new 58th Chrome version :
However, for older browsers it poses a problem. Once solution is to go into corresponding bundle in
node_modules and add line breaks:
Now you can put a breakpoint there. The other option is to add
debuggerstatement inside the function without changing line breaks. But I don’t like adding debugger statements as they can’t be disabled.
When debugging Angular application, I suggest using the minimal setup possible. For example, check this Angular seed project I use for myself.
Debugging in a browser console
Accessing modules
During debugging you may need to get access to a particular module and its exports in the console. This is easy to do if you’re using module loader like SystemJS. It loads modules using
System.import method which returns a promise that is resolved when a module is loaded. So, for example, to access enableDebugTools and disableDebugTools functions from the @angular/platform-browser module you do like that:System.import("@angular/platform-browser").then(function(module) {
enableDebugTools = module.enableDebugTools;
disableDebugTools = module.disableDebugTools;
});
Another option for Angular is Webpack. Since it is a bundle wrapper, not a module loader, it wraps everything inside itself into a bundle and doesn’t provide functionality to access modules outside the bundle similar to a module loader. There are ways to get access to those modules, but most of them require modifying
webpack.config.js, which is very likely to result in a bundle error if you’re not familiar with Webpack configuration.
A simpler solution is to add another file, for example
globals.ts into your project with the following content:import * as core from '@angular/core';
import * as common from '@angular/common';
import * as compiler from '@angular/compiler';
import * as browser from '@angular/platform-browser';
import * as browserd from '@angular/platform-browser-dynamic';
import {isDevMode} from "@angular/core";
if (isDevMode()) {
window['@angular/core'] = core;
window['@angular/common'] = common;
window['@angular/compiler'] = compiler;
window['@angular/platform-browser'] = browser;
window['@angular/platform-browser-dynamic'] = browserd;
}
and include it into the app by simply requiring it from any of your files, usually from
main.ts:import './globals';
In this way, you’ll be able to access required export from a module in the console:
window['@angular/core'].ApplicationRef
If you need to access other modules in a console besides those listed in the file, just add them in the
globals.ts.
This solution with an additional file works perfectly for both SystemJS and Webpack driven environments.
Enabling debugging information
By default, Angular runs in the development mode. You can see the following text in a console:
Angular is running in the development mode. Call enableProdMode() to enable the production mode.`
To disable debugging you need to run Angular in the production mode using
enableProdMode function:import {enableProdMode} from '@angular/core';
enableProdMode();
Angular skips many things when running in the production mode. Some of them include :
- doesn’t add attributes like ng-reflect-…
- doesn’t output important warnings, like the one that tells that some HTML content is stripped
- doesn’t build debugging elements tree (more on that later)
- etc.
Also, in the development mode ApplicationRef.tick()
performs a second change detection cycle to ensure that no further changes are detected. If additional changes are picked up during this second cycle, bindings in the app have side-effects that cannot be resolved in a single change detection pass. In this case, Angular throws an error, since an Angular application can only have one change detection pass during which all change detection must complete
So it’s important to switch modes when developing and deploying.
Debugger implementation in a nutshell
To work with DOM, Angular uses platform dependent Renderers. DefaultDomRenderer is the main class responsible for manipulating DOM in a browser. When the framework runs in the development mode, it also uses DebugRenderer for attaching debug specific information to nodes and delegates DOM operations to the default DOM renderer. In production mode, DebugRenderer is not used.
For each DOM element in a View angular creates peer DebugElement with the debugging information. The debug element tree has almost the same structure as rendered DOM. All created peer debug elements are stored on _nativeNodeToDebugNode map using native DOM element as a key. Whenever
ng.probe(element) is used in a console, corresponding debug element is returned in the form of DebugNode from this map. DebugNode interface defines public API for DebugContext, which in itself is mostly a wrapper around View. I’ve written about views a bit in Exploring Angular DOM manipulation techniques and Everything you need to know about change detection articles.Exploring available debugging information using ng.probe
Angular exposes global
ng.probe function which takes native DOM element and returns corresponding peer debug element. As described above, DebugElement implements DebugNode interface which defines the following public API:class DebugNode {
nativeNode: any
listeners: EventListener[]
parent: DebugElement
injector: Injector
componentInstance: any
context: any
}
Let’s see what these properties hold and how they can be used.
nativeNode
Holds a reference to the native DOM peer element
listeners
Holds listeners registered for the native DOM peer element. For example, if you define your component like this:
@Component({
template: `<span (click)="onClick()"></span>`
})
class MyComponent {
onClick() { console.log('clicked') };
}
and pass the
span reference to ng.probe, the listeners array will contain one listener. If needed you can trigger event handlers registered for an event like this:ng.probe($0).triggerEventHandler('click');
parent
Since debug elements hierarchy resembles DOM hierarchy up to the root component, you can access parent elements using this property. So if you have an html structure like this:
<h1 class="outer">
<span class="inner">some</span>
</h1>
you will have the same structure of debug elements:
var h1 = document.querySelector('.outer')
var span = document.querySelector('.inner');
ng.probe(span).parent.nativeElement === h1;
injector
Creates and returns an accessor to the component injector. It allows accessing all providers on the component injector and its parent injectors. For example, if you have the following setup:
@Component({
selector: 'my-app',
providers: [
{
provide: 'MyAppProviderToken',
useValue: 'MyAppProviderValue'
}
],
template: `<app-literals></app-literals>`
})
class MyApp {}
@Component({
selector: 'a-comp',
template: `<span class="a-comp-span">A component</span>`,
providers: [
{
provide: 'AppLiteralsProviderToken',
useValue: 'AppLiteralsProviderValue'
}
]
})
class AComp {}
You can access both
AppLiteralsProviderToken and parent component token MyAppProviderToken:let span = document.querySelector('.a-comp-span');
// "AppLiteralsProviderValueng.probe(span).injector.get('AppLiteralsProviderToken');
// MyAppProviderValueng.probe(span).injector.get('MyAppProviderToken');
componentInstance
Holds an instantiated component class instance. For example, if you define your component like this:
@Component({
template: `
<h1 class="outer">
<span class="inner">some</span>
</h1>
`
})
class MyComponent {
name = 'C';
}
component instance will contain an instance of the
MyComponent class:let debugNode = ng.probe($0); debugNode.componentInstance.name; // 'C'
If you select elements that belong to the same component view, they will point to the same component instance:
var h1 = document.querySelector('.outer') var span = document.querySelector('.inner'); ng.probe(h1).componentInstance === ng.probe(span).componentInstance
Sometimes you may need to change properties on the component instance.
debugNode.componentInstance.name = 'V';
If they are used in templates you’ll see changes updated in the view during next digest cycle. But you can also trigger updates manually. I’ll show how this can be done later in the article.
context
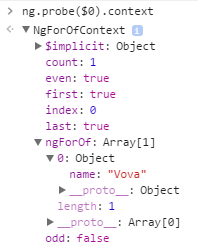
Holds data model used by the component or an embedded view. For the component view this property points to the component instance. For the embedded views, like the one created by
ngFor directives, it holds private data like index, first, last etc. For example, for the following template:<li *ngFor="let item of items; let i = index">
<span>{{i}}</span>
</li>
the context for the inner span shows the following:
This property is useful when debugging structural directives that create its own context like
ngFor.Triggering digest cycle manually
If you have debugging tools enabled, you can simply run:
ng.profiler.timeChangeDetection();
You may remember that this method runs changed detection from the root of the application.
Another approach is to get hold of the ApplicationRef and call its tick method. ApplicationRef is stored in the injector of the root module which is used to bootstrap the app. Since Angular returns bootstrapped module reference from
bootstrapModule method, you can access the injector there:let platform = platformBrowserDynamic();
platform.bootstrapModule(AppModule).then((module) => {
let injector = module.injector;
});
The ApplicationRef is stored in injector using ApplicationRef class reference as a key. So, here is how we can access the Application instance:
import {ApplicationRef} from "@angular/core";
platform.bootstrapModule(AppModule).then((module) => {
let application = module.injector.get(ApplicationRef);
});
However, we can’t access this
application variable from the console unless we define it as a global variable:window.application = module.injector.get(ApplicationRef);
Luckily, since injectors form hierarchy, we can can access values stored in the root injector from any child injector. And since Angular stores ApplicationRef class reference in the
coreTokens global variable, here is how we can run change detection manually using ng.probe and child injector:ng.probe($0).injector.get(ng.coreTokens.ApplicationRef).tick();
Using debugging tools
Angular also provides some debugging tools. Do not confuse them with the debugging information you get through
ng.probe. These debugging tools are independent of the mode in which Angular runs. They can be enabled both in development and production mode by calling enableDebugTools function that is exported from the platform-browser module. This function takes a ComponentRef and uses it to get hold of the ApplicationRef. You can enable debugging tools either inside your code:platform.bootstrapModule(AppModule).then((module) => {
let applicationRef = module.injector.get(ApplicationRef);
let appComponent = applicationRef.components[0];
enableDebugTools(appComponent);
});
or from a console of a running application.
System.import("@angular/platform-browser").then(function(module) {
  enableDebugTools = module.enableDebugTools;
  disableDebugTools = module.disableDebugTools;
});
var componentRef = ng.probe($0);
enableDebugTools(componentRef);
The only thing that is required is having a reference to any component to pass it inside
enableDebugTools. To access the reference in the console you have to either expose it from any of your modules or use ng.probe.
In the 4.x.x version Angular provides only one debugging tool — profiler. The one thing it can do at the moment is to time change detection. Here is what angular says about it:
Exercises change detection in a loop and then prints the average amount of
time in milliseconds how long a single round of change detection takes for
the current state of the UI. It runs a minimum of 5 rounds for a minimum
of 500 milliseconds.
It can be accessed through global variable
ng.profiler in a console:ng.profiler.timeChangeDetection();
It simply runs multiple change detection cycles starting from the root component and calculates how much time each cycle takes on average. The profiler reports this information in the following form:
ran 5 change detection cycles
platform-browser.umd.js:4326 4480.59 ms per check
It can also create a CPU profile in the
Profiles tab of your browser if you pass {record:true} parameter:ng.profiler.timeChangeDetection({record:true});
That’s all folks!


No comments:
Post a Comment